
Anatomy of Hate Speech Datasets: Composition Analysis and Cross-dataset Classification
Samuel Guimarães, Gabriel Kakizaki, Philipe Melo, Márcio Silva, Fabricio Murai, Julio C. S. Reis, Fabrício Benevenuto
Published in HT '23: 34th ACM Conference on Hypertext and Social Media · DOI: 10.1145/3603163.3609158 · License: © Copyright held by the owner/author(s). Publication rights licensed to ACM.
Authors: Samuel Guimarães, Gabriel Kakizaki, Philipe Melo, Márcio Silva, Fabricio Murai, Julio C. S. Reis, Fabrício Benevenuto
Keywords: Abusive Speech, Classification, Datasets, Hate Speech, HateBase, Offensive Speech, Toxicity
Session: Social and Intelligent Media: Through the mirror of social media
Conference: HT '23
Abstract
Manifestations of hate speech in different scenarios are increasingly frequent on social platforms. In this context, there is a large number of works that propose solutions for identifying this type of content in these environments. Most efforts to automatically detect hate speec
Manifestations of hate speech in different scenarios are increas- ingly frequent on social platforms. In this context, there is a large number of works that propose solutions for identifying this type of content in these environments. Most efforts to automatically detect hate speech follow the same process of supervised learning, using annotators to label a predefined set of messages, which are, in turn, used to train classifiers. However, annotators can create labels for different classification tasks, with divergent definitions of hate speech, binary or multi-label schemes, and various methodolo- gies for collecting data. In this context, we examine the principal publicly available datasets for hate speech research. We investigate the types of hate speech (e.g., ethnicity, religion, sexual orienta- tion) present in their composition, explore their content beyond the labels, and use cross-dataset classification to examine the use of the labeled data beyond its original work. Our results reveal in- teresting insights toward a better understanding of the hate speech phenomenon and improving its detection on social platforms. Warning. This paper contains offensive words and tweet examples.
1 Introduction
The Web has changed how our society communicates, and it evolved towards social platforms, where users share a large variety of content and freely express themselves by posting personal opinions. Unfortunately, these platforms have become the stage for numerous cases of online hate speech, usually defined as attacks on a person or a group based on race, religion, ethnic origin, sexual orientation, disability, or gender [23]. Hate speech has been recognized as a pressing problem by many segments of society and authorities from many countries [24, 42]. Some already took the first steps toward regulating hate speech in social networks [31]. Not surprisingly, many recent research efforts have attempted to operationalize the concept of hate speech (i.e., to define it in terms of measurable factors) to identify and counter it. The fundamental challenge is that, even in our society, there is no universally accepted definition of hate speech [19]. As a result, the prevailing practice is to gather datasets through Web and social network crawling and then enlist human annotators to label the messages as either hate speech or non-hate speech. In many cases, a classifier is also trained using the annotated corpus, resulting in a model that captures the concept of hate speech given by the data and predicts whether a message contains it. These approaches often present limited accuracy in terms of precision and recall and are possibly affected by bias from annotators [49]. Warning. This paper contains offensive words and tweet examples.
Ccs Concepts
• Human-centered computing →Social network analysis; • Applied computing →Sociology. On the other hand, manual human moderation on the Web of hate speech content can be prohibitive due to the high cost and large volume of data [5, 51]. There are many cases of news websites even turning off their comments section to avoid toxic behavior due to a lack of resources for moderation [18, 32]. Some later resorted to automated techniques, such as the NY Times [51], which reactivated the comments section using the Perspective API1. This tool utilizes a series of machine learning models to calculate a “toxicity score”, which measures the potential impact that a comment may have on the environment. Nevertheless, it is worth noting that the toxicity score and other automatic hate speech detection tools that measure the degree of harmfulness in a piece of text have certain biases and limitations that may affect their accuracy [20, 30, 49]. For example, they are sensitive to the passive voice [27], the score may not accurately capture the nuances of some contexts or cultures [11], and the subjective opinions of those who created it may create biases [11, 46]. In this paper, we provide an in-depth analysis of datasets widely used in the literature to operationalize the concept of hate speech. Specifically, we investigate the key elements that can affect the implicit definition of hate speech captured by the models trained with this data: (1) the composition of datasets used to train the model, and (2) how this composition affects the use of a set for more general classification tasks. Therefore, we direct our efforts towards inspecting and comparing different datasets for hate speech detection using the well-known crowdsourced corpora terms of the HateBase2 (i.e., an online repository of structured, multilingual, and usage-based hate speech) and cross-dataset classification to provide more transparency for those wanting to use of them to build new techniques and models. Next, we summarize the main findings and contributions from our analysis: related work. We then describe the datasets and their composition, describing what we used for this work (Section 3). Later, we show our results and discuss their implications (Section 4). Lastly, we deliver our concluding remarks and present directions for future research. 2
Related Work
Online hate speech is a critical problem in modern society, recognized by authorities of many countries as something to be urgently addressed [24, 31, 42]. In this scenario, many studies emerged aimed at providing a solution to this phenomenon on the Internet, taking several approaches and contributing to different steps in characterizing and detecting hate speech. In particular, one line of research investigates the most common targets of the hateful messages exchanged on social networks, sometimes creating lexicons of hate terms [15, 39, 48, 50, 52]. This characterization helps divide hate into subcategories. Furthermore, some works proposed taxonomy divisions for hate speech, going beyond targets [16, 48, 55]. For example, two studies explored the difference in explicit or implicit hate, creating a taxonomy that could help to find more subtle types of hatred [16, 55]. Some studies focus on authors of the hate content, enabling the detection of accounts that produce hate speech regularly instead of individual messages [10, 38, 45]. In addition to analyzing the published content, these works proposed metrics related to engagement and other account behaviors on online platforms to detect hateful profiles. Altogether, these analyses of accounts, lexicons, and taxonomies propelled several advances toward creating new data collection and labeling strategies for tackling online hate speech. In a similar direction, some research groups created hate datasets based on specific contexts, usually in scenarios where attacks target a given group. For instance, during the COVID-19 pandemic, there was a noticeable increase in Anti-Asian hate [29]. Thus, recent studies analyzed how racial hatred spreads during a pandemic [29, 54]. These novel datasets help expand the knowledge of hate terms used for hate [54] by discovering new keywords and expressions of this unfamiliar context that can facilitate further research on the same topic. Recent surveys indicate that most previous data collection efforts focused on Twitter with labeling done with a combination of manual annotation by experts and non-experts, sometimes with machine learning assistance using a list of common negative words [2, 19, 44]. Other data sources (i.e., platforms) were studied, including YouTube [9], Facebook [14], 4Chan [59], Gab [35, 58], and even political manifestos [33]. However, some issues are found in many datasets and in contrasting them. For example, a few works evaluate the problem of hate speech with distinct definitions and general objectives for the labeling, having entirely different annotation schemes. For some, a specific type of hate (e.g., racism) is labeled [9, 56]. In other cases, types of speech that have intersections with hate speech are also labeled, including text found offensive [13], abusive [21], or aggressive [6]. Finally, there are also datasets with multiple labels for each message, allowing for more than one classification task for the same data [6, 37]. Following suggestions for differentiation between directed and generalized hate speech [12], some datasets also have labels for this task [6]. • Although different datasets share many similarities in the forms of hate, such as attacks on gender and ethnicity, they also frequently present conflicting definitions of hate speech and different levels of hate (e.g., varying degrees of explicitness in the attacks or usage of profanity terms); • Dataset composition may be explained by the data collection strategy chosen and that directly affect in kinds of hate captured by each one; • Using the crowdsourcing lexicon of HateBase, it is possible to augment hate speech datasets with the types of hate they contain and thus better understand their composition beyond their original labeling; • The profile of hatred of each dataset can directly affect the use of data in further research, as the dataset with a more balanced type of hate portrayed the best results in terms of Mean Rank and Mean Penalty of the Weighted Macro F1 score in our cross-dataset classification task. In sum, we hope our results can help improve hate speech detection, better understand its phenomenon on social media, and indicate future solutions, for example, how to tweak the labeling of datasets to create more generalist datasets. In the rest of the paper, we explore the following. In the next section, we present 1https://www.perspectiveapi.com 2hatebase.org Anatomy of Hate Speech Datasets: Composition Analysis and Cross-dataset Classification Efforts introducing novel labeled datasets often also evaluate the accuracy of several classification models on that data [13, 14, 25, 40, 54]. In contrast, other works focus exclusively on proposing new hate speech detection techniques and compare their performance with existing approaches on already known datasets [3, 8, 22, 41]. Jigsaw Group from Google launched the Perspective API3, a popular API that uses machine learning models to score how a comment can impact a conversation to end it, creating a toxicity index to measure how toxic a message can be perceived by a user [1]. Toxicity is a broader concept than hate speech, including other categories of offensive, abusive, and aggressive content, which may be undesired to online platforms. As a result, detecting toxic content is more straightforward and can be more easily deployed. Many research works have used the Perspective model and its definition of toxicity, and some even use it to detect hate speech [15, 34, 35, 43, 49, 60]. However, other works have pinpointed biases of the model and proposed ways to address them [7, 27, 28, 30, 53]. More recently, with the development and popularization of transformer language models, new efforts explored deep learning-based architectures to classify hate speech [4, 25, 26, 54], frequently establishing new state-of-the-art results. Although these efforts offer significant advances in this field, the vast majority are purely data-driven techniques, meaning they rely on data sources to define hate speech, which might be inconsistent. More precisely, when a model trained on a dataset cannot accurately detect hate speech on another, it reveals a generalization issue due to commonly ignored specificities inherent in hate speech (e.g., types). Moreover, the classification step is not always completely aligned with the dataset used for its training results in models that detect different things from what they were designed for. Therefore, our study aims to provide more transparency in the data operationalization of the hate speech concept by performing a quantitative analysis of widely used and well-known datasets based on English data from social networks. While some surveys have analyzed many available datasets, our work differs by using the HateBase, a large corpus of crowdsourcing labeled terms used in online hate speech, and by applying NLP techniques to compare the types of hate that compose the annotated data, including crossdataset classification by training and testing on different datasets to measure the cited generalization problem. However, each one has its procedure for gathering and annotating data. In such a way, they may use diverse hate speech data to accomplish this task. Some research [12, 47, 60] showed that even human annotators supplied with hate speech definitions do not lead to highly consistent corpora. Although these studies used social networks to get data and have analogous strategies and descriptions, they used selective lists of keywords and terms to find the hate speech on these platforms, which may lead to datasets with contrasting forms of hate. Thus, to conduct our experiments we selected well-known datasets from the literature. Our choice was guided by recent surveys of the research area [2, 44], focusing on the most cited works. For this work, we use four distinct datasets, these containing messages labeled as hate and non-hate speech, mainly from Twitter: Waseem [56], Davidson [13], Founta [21], HASOC2019 [37], HASOC2020 [36]. The description summary of datasets is shown in Table 1, presenting the original number of tweets found, how many judges were responsible for annotation, the label names used for the task, and how many tweets we had after pre-processing. We performed a series of basic pre-processing to normalize the data. Besides replacing users’ mentions and URLs with placeholders, @USER, and URL, respectively, we also removed all duplicated messages to ensure the uniqueness of each one. We also replaced emojis for text using the emoji python package4, removed the ‘#’ symbol from hashtags leaving the text, and eliminated any extra blank spaces or new lines. Finally, we merged some labels and discarded others, as our focus is the binary task of distinguishing hate and non-hate speech. Between these changes, we also removed a few messages with contradictory labels, mainly with the same text and different labels. Next, we give a more detailed description of each set, pointing out the differences in their construction and some adjustments we applied. Waseem Dataset. First, this dataset [56] tackles hate speech in only two forms: sexism and racism. In this work, the authors manually label 16k tweets collected in 2 months by searching messages containing common slurs and terms about religious, sexual, gender, and ethnic minorities on Twitter, such as “Feminazi”, “Victim Card”, or “Not all men”. They had the help of an outside annotator from the specific area of studies that deals with hate speech towards these groups to evaluate the correctness of their labeling. From the 16, 909 original messages found in the dataset, we removed some repeated hate messages, finding after our pre-processing 16, 541 tweets, 1, 962 with the racist label and 3, 358 with sexist ones. We fused these labels as hate (5, 320 tweets) and kept the “neither” class (11, 221 tweets). 3
Datasets
With the theme’s popularity, various efforts concerned with producing hate speech databases from social networks have emerged. Some of these studies used similar definitions of hateful messages, particularly distinguishing them from offensive content. A previous survey [19] found that these definitions generally cover the presence or absence of certain aspects. Hate speech commonly has specific targets, it is to incite violence or hate, and it is to attack or diminish certain groups of people. Both Founta [21] and Davidson [13] works, for example, define it similarly as “Language used to express hatred towards a targeted individual or group, or is intended to be derogatory, to humiliate, or to insult the members of the group, on the basis of attributes such as race, religion, ethnic origin, sexual orientation, disability, or gender”. Davidson Dataset. The authors of this work [13] built a dataset primarily focused on the distinction between hateful and offensive language. According to the authors, the main difference is the derogatory use of the offenses. To properly separate the definitions they give, they used three labels: hateful, offensive, and non-offensive. They build the corpora using the Twitter API5 to search for tweets containing terms of a keywords list compiled from 4https://pypi.org/project/emoji/ 5https://developer.twitter.com/ 3https://www.perspectiveapi.com Table 1: Summary of hate speech datasets. Red mark hate speech labels and Black are labels considered as non-hate. #Total Instances #Judges Labels After Preprocessing Hate vs Non-hate Waseem [56] 16,909 2 Racism (1,976 ±11.69%), Sexism (3,432 ±20.30%), Neither (11,501 ±68.01%) 16,541 5,320 vs 11,221 Davidson [13] 24,783 3 Hate Speech (1,430 ±5.77%), Offensive Language (19,190 ±77.43%), Neither (4,163 ±16,80%) 24,539 1,417 vs 23,122 Founta [21] 99,996 5+ Hateful (4,965 ±4.97%), Abusive (27,150 ±27.15%), Spam (14,030 ±14.03%), Normal (53,851 ±53.85%) 85,466 3,962 vs 81,504 Hate Speech (1,143 ±19.53%), Offensive (667 ±11.40%), Profane (451 ±7.71%), Non Hate/Offensive (3,591 ±61.36%) 5,731 1,129 vs 4,602
Hasoc2019 [37]
5,852 3 Hate Speech (158 ±4.26%), Profane (1,377 ±37.13%), Offensive (321 ±8.66%), Non Hate/Offensive (1,852 ±49.95%) 3,677 158 vs 3,519
Hasoc2020 [36]
3,708 11 HateEval [6] 10000 3 Hateful (4,210 ±42.10%), Non-Hateful (5,790 ±57,90%) 9,927 4,193 vs 5,734 the HateBase. They created a collection of 85.4 million tweets, later randomly sampled to make a final 25k set. This data was manually labeled using CrowdFlower crowdsourcing platform6 annotators for hateful, offensive (but not hateful), or neither. There were no repeated messages on this dataset, yet the original paper cites 24, 802 tweets, more than the data currently available. As we focus on the binary task of detecting hate speech, we fuse the texts marked as offensive with those labeled as neither. As a result, we use a dataset of 23, 122 regular tweets versus 1, 417 hateful ones. dataset [37]. There were two levels for the labels used: hate versus not hate (binary classification) and hate, offensive, or profanity versus not hate (multilabel classification). They implemented a strategy of collecting tweets using hashtags and keywords related to offensive content, separated for the three languages. With some tweets, the organizers also collected more data from profiles present in the initial tweets to increase variety, based on previous work [57]. The track also aimed to stimulate the creation of new datasets for two languages with fewer resources: German and Hindi. The tree datasets in English, German, and Hindi were collected from Twitter and Facebook and made available as train and test sets. We only used the English train set because it has a language comparable to the other datasets, and the test set did not contain the labels. In our pre-processing, we found four messages repeated twice with conflicting annotations. After their removal, we had 5, 731 tweets, 1, 129 hateful, and 4, 602 non-hateful. Founta Dataset. Regarding this dataset [21], the approach taken was different. It started with a random sample of all tweets within ten days. Then they applied simple text analysis and machine learning to create a boosted set of tweets, as abusive tweets are rare. They used this strategy to improve coverage of the minority classes of hate. Using Boosted sampling in part of the dataset improves hateful proportion enough to be richer in examples from those classes. They also used CrowdFlower to label instances as Offensive, Abusive, Hateful, Aggressive, Cyberbullying, Spam, or Normal. The authors used at least five judgments for the majority label of each tweet, with some tweets having more than that due to more than one round of annotations due to their methodology of exploring the best labeling. They used 43 judges in the worse case. After analyzing this initial annotation, they decided that the Aggressive label had a large intersection with Abusive content and that Cyberbullying had too few positive instances. The final set used their data with 80, 000 instances labeled only for Abusive, Hateful, Spam, or Normal. From those, we map some to hate and some to non-hate classes to our problem. Later, the authors continued the same process, expanding the dataset to almost 100, 000 tweets. However, we found 8, 399 repeated messages with contradictory annotations, reaching 366 combinations of the labels. As our focus was to separate the hateful class from all the others, we removed any case where the hateful class mixed with the others. After our pre-processing, the final dataset had 85, 466 tweets, 3, 962 marked as hate, against 81, 504 labeled as non-hate. HASOC2020 Dataset. The FIRE conference continued the HASOC track in the following years. In 2020, the organizers changed the data collection and annotation methodology [36]. They collected more recent tweets from an extensive Twitter archive from the Internet Archive 7, then trained SVM classifiers for each language, based on HASOC2019 and data from related works, to create an initial label for this new set of messages. They expected to reduce bias in the selected tweets using more randomly sampled data. Later, native speakers manually labeled the messages initially classified as hate and a random sample of 5% of the ones marked as non-hate. The organizers added two more languages to the task, MalayalamEnglish, and Tamil-English, as well. The final scores were lower than the previous HASOC2019, probably due to a more challenging dataset to classify. In this case, we found no repeated tweets. HateEval Dataset. Similarly, the SemEval 2019 conference created the HateEval dataset for its Task 5 challenge [6], which focused on detecting hate speech against immigrants and women in Spanish and English messages extracted from Twitter. This objective meant the organizers only labeled tweets with hate with migrants or women as targets for the positive class. In this case, any other tweet, including offensive or abusive with different targets, was labeled as non-hateful. The data collection methodology mixed three different strategies: (1) using previously known hate keywords; (2) searching HASOC2019 Dataset. The HASOC track of the FIRE conference created a challenge to separate offensive/hateful messages from non-offensive/hateful content, which included the creation of a 6Later renamed Figure Eight https://visit.figure-eight.com/People-Powered-DataEnrichmentT 7https://archive.org/ Anatomy of Hate Speech Datasets: Composition Analysis and Cross-dataset Classification Table 2: Ranked terms from HateBase more frequent on each dataset hate instances. Dataset #Mentions of Terms Terms Waseem [56] 494 bitch (22.1%), slave (16.8%), idiot (11.1%), cunt (6.9%), gay (6.5%), slut (3.4%), jihadi (3.0%), property (2.6%), whore (2.0%), jihadis (1.8%) Davidson [13] 2,052 bitch (13.0%), faggot (12.3%), nigga (10.5%), nigger (8.2%), trash (5.6%), fag (5.4%), hoe (4.9%), white trash (3.0%), pussy (2.5%), queer (1.8%) Founta [21] 1,769 nigga (43.4%), idiot (18.5%), bitch (12.2%), hoe (2.8%), retarded (2.5%), gay (2.1%), retard (1.6%), pepsi (1.0%), trash (0.9%), af (0.8%)
Hasoc2019 [37]
62 idiot (17.7%), bengali (8.1%), trash (8.1%), queen (6.5%), chief (6.5%), af (6.5%), jihadi (4.8%), punjab (4.8%), abc (4.8%), gay (3.2%)
Hasoc2020 [36]
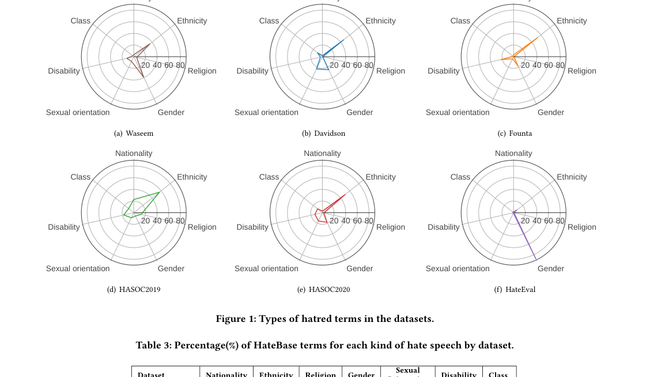
38 nigga (28.9%), bitch (15.8%), gay (13.2%), idiot (10.5%), trash (10.5%), ghetto (2.6%), queen (2.6%), yank (2.6%), ike (2.6%), jihadi (2.6%) HateEval [6] 2,521 bitch (40.5%), hoe (12.3%), whore (12.2%), cunt (10.9%), pussy (6.6%), slut (4.5%), nigga (2.1%), trash (1.1%), idiot (1.1%), ann (0.6%) for potential targeted accounts; (3) collecting data from identified hate profiles. The organization made a training set composed of 10, 000 messages and the test with 3, 000 tweets available, although the test set did not contain the labels. For this reason, we only focus on the training set. From this data, we removed two instances of repeated messages with the same annotation, leaving us 9, 927 tweets, 4, 193 labeled as hateful, and 5, 734 as non-hate. Overall, we note that each dataset was created from different strategies, with distinct objectives and classification tasks in mind, but sometimes with common characteristics, like the presence of labels for offensive speech. We expect these initial differences to affect our following analysis. to all. For example, ‘bitch”, “idiot”, “nigga” are highly related to hate speech in almost all scenarios. Moreover, it is notable that some shades of hate in the direction of sexism (“cunt”, “whore”, “pussy”), homophobia (“faggot”, “queer”, “gay”), and racism (“nigga”, “nigger”) seem prevalent, considering the abundant presence of these expressions in the messages labeled as hate on the datasets. As the hate lexicon of HateBase has explicit information about the kind of hate related to each term, we also calculated the frequency of nationality, ethnicity, religion, gender, sexual orientation, disability, and class terms for each dataset, as shown in Figure 1. The results show marked variations across datasets. For example, Davidson (Figure 1(b)) has the highest presence of sexual orientation hate. Waseem (Figure 1(a)) has a more concise distribution, presenting their data as very gender oriented, as they have almost 40% of hate terms related to it. However, they also have a high frequency of words about ethnicity (35.84%), in a close second place. Founta has a very similar shape but has a greater tendency toward disability (Figure 1(c), the highest percentage compared to the other sets. Yet, the primary category of this dataset is hate related to ethnicity, the second highest. The option with the highest concentration of ethnic hate was the HASOC2019 dataset (Figure 1(d)). It is also the most balanced, with almost all categories with doubledigit percentages. It also is the option with the least amount of gender-related hatred. In contrast, the HateEval dataset is almost entirely composed of gender hate (Figure 1(f)). Due to its focus on women and immigrants as targets, it makes sense that gender and ethnicity are the two highest percentages. However, the skew towards hate related to gender is still surprising, being more than 88%. Finally, the HASOC2020 composition (Figure 1(e)) is similar to Founta and Davidson, being a middle point between the two in most categories. Compared to HASOC2019, it mainly has fewer terms concerning nationality and religion and more on gender and sexual orientation. Table 3 shows the percentage values of expressions from HateBase associated with different kinds of hate in each dataset. Note that a single term can be related to multiple kinds of hate. Thus, the sum is not necessarily 100%. The “hate bias” of each dataset reflects the presence of words in it, and we can explain it partially by the construction strategy for some datasets. For example, Davidson and Founta used HateBase to 4
Composition Analysis And
Classification
In this section, we describe the results of our experiments. We start by exploring the composition of different datasets, quantifying the kind of bias they might have. Then, we detail our classification setup process and analyze the results of our cross-dataset classification in the sets. 4.1 Composition of Datasets As each dataset author used a different methodology to collect and label the data, we investigate the characteristics that make each dataset unique concerning the definition of hate adopted by each one. Our first step is identifying the different kinds of hatred within our data. For that, we use the HateBase, an open, collaborative, regionalized repository of multilingual hate speech containing an extensive lexicon of 3, 894 crowdsourced terms used in online hate speech raised by users around the world. Those terms also have tagged the class of hate associated with it (e.g., nationality, ethnicity, religion, gender, sexual orientation, disability, and class). For each dataset, we then count the frequency of expressions from HateBase vocabulary, considering only the sentences labeled as hate. Table 2 shows the most frequent terms from the HateBase found in each dataset based on how many times they were mentioned. These results show some recurring words among all sets. Although each has used its methodology, some expressions are common Nationality Nationality Ethnicity Class Class 20 40 60 80 Religion Disability Disability Gender Sexual orientation Gender Sexual orientation (a) Waseem (b) Davidson Nationality Nationality Ethnicity Class Class 20 40 60 80 Religion Disability Disability Gender Sexual orientation Gender Sexual orientation (d) HASOC2019 (e) HASOC2020 Figure 1: Types of hatred terms in the datasets. Table 3: Percentage(%) of HateBase terms for each kind of hate speech by dataset. Dataset Nationality Ethnicity Religion Gender Sexual Orientation Disability Class Waseem [56] 3.64% 35.83% 5.06% 39.47% 8.91% 12.35% 2.23% Davidson [13] 1.80% 46.88% 0.68% 24.71% 23.25% 3.56% 11.06% Founta [21] 3.34% 53.14% 0.62% 18.26% 4.02% 22.78% 1.36%
Hasoc2019 [37]
22.58% 56.45% 12.90% 6.45% 9.68% 17.74% 11.29%
Hasoc2020 [36]
2.63% 50.00% 2.63% 18.42% 15.79% 13.16% 10.53% HateEval [6] 1.67% 7.50% 0.75% 88.34% 0.95% 1.43% 1.71% find tweets containing hate, which led to a high occurrence of these terms in the datasets. Waseem used sexist or racial slurs as criteria and labels for hate speech. Therefore, there are more terms related to these topics. HASOC2019 focused on more general hate speech without considering specific targeted groups but on hashtags, which justifies the most balanced distribution. Inversely, HateEval had two target groups of interest but is very skewed towards hate against women. Lastly, HASOC2020 tried to remove bias in data collection and subsequently created a profile closer to Founta and Davidson. Regardless of the approach taken, hate toward ethnicity and gender appeared in all datasets, suggesting that they are more common on online platforms or easier to identify. Finally, we generated a word cloud of the top 200 most frequent words from tweets labeled as hate speech across all datasets, presented in Figure 2. For all datasets, the most frequent word was the token @USER used to replace a mention of a Twitter profile. The tokens URL used for replacing a link and the word RT, used in the past to mark retweets, were also in the top 5 of all sets. Focusing on the actual content of the datasets, we remove these three items from the Nationality Ethnicity Ethnicity Class 20 40 60 80 20 40 60 80 Religion Religion Disability Gender Sexual orientation (c) Founta Nationality Ethnicity Ethnicity Class 20 40 60 80 20 40 60 80 Religion Religion Disability Gender Sexual orientation (f) HateEval word clouds. After this cleaning, we analyze the terms presented in the figures. We note that most of them are not specific hate words that can be present also in non-hateful messages. Among the most popular, there are context-specific hashtags, profanities, and also some terms from the HateBase. The data with the hate terms more prominently in the word cloud were from the Davidson dataset. After it, we have HateEval, Founta, HASOC2020, and Waseem in order. Interestingly, the HASOC2019 dataset has no terms from the HateBase in their top 200 most frequent words. For Davidson, the word “bitch” became the most frequent, which, with the higher presence of hate terms, might be related to its data collection methodology. This characteristic is probably due to some of the keywords used in their approach to search for tweets are also included in HateBase. HateEval has the same most frequent word, besides being similar to Davidson in the amount of HateBase terms. One difference is the presence of more words related to American politics in words like “#buildthewall” or “Trump”. Meanwhile, Waseem has the hashtag “#MKR” as one of the most frequent Anatomy of Hate Speech Datasets: Composition Analysis and Cross-dataset Classification (a) Waseem (b) Davidson (c) Founta (d) HASOC2019 (e) HASOC2020 (f) HateEval Figure 2: Most frequent words in each dataset. HateBase words in red. words, along with sexist and Islam, which relate to its construction. This (hash)tag, an acronym for the TV show My Kitchen Rules, is recurring as the comments about the show are the context used for data collection. After it, the tagging of sexist and racist comments points to the other relevant words. The most prevalent word in the Founta dataset is hate. Followed by an emoji called “Face with tears of joy”, the profanity word “fucking”, and then two forms of the n-word. This order seems to relate to the high ethnicity type of hate in its composition and possibly to a very structured kind of hate related to the phrase: “I hate <target>”. This sentence structure was studied before in the context of hate speech on Twitter [39, 50]. Indeed, 15.45% of the messages labeled hate contained the word hate. In these tweets, 46,12% of the use of the word hate is in this form, 14.61% of the use of the word hate included the n-word, and in the intersection of these two uses, 19.14% of the “I hate <target>” had the n-word present in the target. HASOC2020 has a similar amount of terms from the HateBase, but the most common words generally are curse words like “shit”, “fuck”, “fucking”, and “ass”. As seen in Table 3, HASOC2020 and Davidson have the highest presence of hate against sexual orientation, and indeed they have the word gay in their cloud. Finally, HASOC2019 has the least quantity of hate terms, with none in the top 200. The most common word found is the hashtag “#TrumpIsATraitor”. This hashtag, and others targeting Former Prime Minister of the United Kingdom, Boris Johnson, and Prime Minister of India, Narendra Modi, show that many tweets considered hate speech on the dataset targeted politicians. Comparing this initial version of the HASOC track dataset with the later HASOC2020, we see that the latter improved in finding a less context-specific type of hate, as the authors intended [36]. The fewer HateBase terms in some of the datasets also could indicate that the hate is probably less apparent and of a more discreet type. The characterization via the HateBase only points to some types of hatred of part of the data. However, we expect that it captures the differences that can help distinguish the results of our next section. 4.2 Measuring Performance of Classifiers To better measure the performance of algorithms in each dataset, we considered state-of-the-art machine learning methods. Currently, BERT models and models using BERT embeddings give the best results for this task [2]. Based on this, we chose to perform a finetuning strategy to a model from a related work that has retrained a BERT model based on Reddit [8] and which found better results than using fine-tuning to the standard BERT model available8. With the code for fine-tuning and the pre-trained HateBERT, we adapted the code to include class weights to the cross entropy loss function to deal with the imbalanced classes. The hyperparameters stayed the same, with our results using 5-fold cross-validation. For each dataset, we divided the data for train and testing. We considered the fine-tuning of HateBert for each training set as a different model, and correctly classifying each test set is a different 8https://huggingface.co/bert-base-uncased Table 4: MacroF1 results of using cross-dataset classification. Best task results in bold. Task (Testing Set) Model (Training Set) Waseem Davidson Founta
Hasoc2019
Hasoc2020
HateEval Waseem 0.815±0.178 0.653±0.074 0.899±0.036 0.701±0.024 0.855±0.065 0.644±0.028 Davidson 0.588±0.044 0.939±0.004 0.935±0.003 0.717±0.006 0.938±0.004 0.467±0.037 Founta 0.666±0.122 0.894±0.018 0.949±0.012 0.729±0.005 0.933±0.006 0.536±0.029
Hasoc2019
0.603±0.076 0.915±0.001 0.931±0.001 0.723±0.009 0.932±0.005 0.446±0.043
Hasoc2020
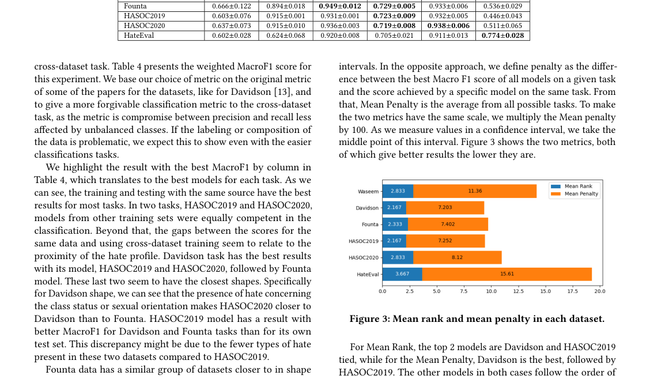
0.637±0.073 0.915±0.010 0.936±0.003 0.719±0.008 0.938±0.006 0.511±0.065 HateEval 0.602±0.028 0.624±0.068 0.920±0.008 0.705±0.021 0.911±0.013 0.774±0.028 cross-dataset task. Table 4 presents the weighted MacroF1 score for this experiment. We base our choice of metric on the original metric of some of the papers for the datasets, like for Davidson [13], and to give a more forgivable classification metric to the cross-dataset task, as the metric is compromise between precision and recall less affected by unbalanced classes. If the labeling or composition of the data is problematic, we expect this to show even with the easier classifications tasks. We highlight the result with the best MacroF1 by column in Table 4, which translates to the best models for each task. As we can see, the training and testing with the same source have the best results for most tasks. In two tasks, HASOC2019 and HASOC2020, models from other training sets were equally competent in the classification. Beyond that, the gaps between the scores for the same data and using cross-dataset training seem to relate to the proximity of the hate profile. Davidson task has the best results with its model, HASOC2019 and HASOC2020, followed by Founta model. These last two seem to have the closest shapes. Specifically for Davidson shape, we can see that the presence of hate concerning the class status or sexual orientation makes HASOC2020 closer to Davidson than to Founta. HASOC2019 model has a result with better MacroF1 for Davidson and Founta tasks than for its own test set. This discrepancy might be due to the fewer types of hate present in these two datasets compared to HASOC2019. Founta data has a similar group of datasets closer to in shape it, with HASOC2020 model having results for Founta tied to its own task, which only happens with Founta. Again, class and sexual hatred might affect the results, making HASOC2020 task more challenging to classify. Founta is indeed the more effortless dataset to detect hate in all cases, and models trained on different data frequently exhibit better test performance on Founta than on their original tasks. Finally, HateEval is very dissimilar to the other datasets, with worse MacroF1 for cross-dataset classification versus using only the same data source. The dataset heavily focuses on gender-related hate, and the only set with a closer proportion of this category is Waseem. As expected, Waseem model has the second-highest MacroF1 for the HateEval task. However, no model has results above 0.7 for Waseem task besides the model with the same data. To measure the results more quantitatively, we calculate the Mean Rank and Mean penalty of the datasets used for training models in all tasks, similar to previous works about model comparisons [17]. To find the Mean Rank, we compute the rank of all the models on each task based on the Macro F1 score and report the average for a model across all tasks. The Mean Rank helps us determine which data trains the model that repeatedly gives the best Macro F1 score, considering the statistical ties in the confidence intervals. In the opposite approach, we define penalty as the difference between the best Macro F1 score of all models on a given task and the score achieved by a specific model on the same task. From that, Mean Penalty is the average from all possible tasks. To make the two metrics have the same scale, we multiply the Mean penalty by 100. As we measure values in a confidence interval, we take the middle point of this interval. Figure 3 shows the two metrics, both of which give better results the lower they are. Figure 3: Mean rank and mean penalty in each dataset. For Mean Rank, the top 2 models are Davidson and HASOC2019 tied, while for the Mean Penalty, Davidson is the best, followed by HASOC2019. The other models in both cases follow the order of Founta, HASOC2020, Waseem, and finally, HateEval. As expected, this result seems to quantify the fact that Davidson, HASOC2019, and Founta form a group of similar enough datasets to give better cross-dataset performance than the rest. These results indicate that our use of the HateBase to characterize the different datasets sheds light on the compatibility between them. We also see that if a type of hatred is the focus, as in the case of HateEval, a more specific labeling of the hate category is better, as the proportions of other types of hate affect the results. However, if we use multiple labels, like in the cases of the two HASOC sets, we expect that different subsets of the data might produce better results across datasets. 5
Conclusion
In this work, we propose an analysis of the hatred found in different datasets, characterizing the categories of hate found in each through the HateBase, examining the different labeling, and implementing a fine-tuned BERT model to show, using cross-dataset classification, the compatibility of the distinct sets. We see that even though each set of data has a different methodology, some forms of hatred are common to all, like attacks on gender and ethnicity present in words like “bitch” or “nigga”. The datasets from Davidson [13], Founta [21], and HASOC2020 [36] Anatomy of Hate Speech Datasets: Composition Analysis and Cross-dataset Classification
Figures

References
have similar profiles of hatred found via the hate terms. HateEval [6] is skewed toward attacks related to gender, which makes it more compatible with the Waseem dataset [56], which focuses on racism and sexism. Finally, the HASOC2019 [37] has the most balanced and varied types of terms from the HateBase. Through the collection and annotation methodology of each set, we can explain, at least partially, the presence of different hate terms in them, which affects the use of one dataset for the classification of the others. Looking at the composition of the data beyond the HateBase proportions, we use word clouds to present the most frequent words. We found the most HateBase terms in data from Davidson. After it, HateEval, Founta, Hasoc2020, and Waseem have fewer terms, and Hasoc2019 had no explicit hate term found in its top 200 most frequent words. The fewer HateBase terms in some datasets also might indicate that the hatred is probably less apparent and more discreet. The token @USER used to replace a mention of a Twitter profile was the most common word in all datasets. The tokens URL, used for replacing a link, and the term RT, previously used to mark retweets, were also in the top 5 of all sets. After removing this common characteristic from the word clouds, we found other results from the final visualizations. The most predominant term in the Founta dataset is hate. From that result, we found possible evidence for structured hate speech messages related to the phrase “I hate <target>”. Furthermore, from the hashtags present in the HASOC2019 dataset versus the top words from the more recent HASOC2020, we can see that some data collection strategies can affect the bias of the data towards more contextspecific types of hate. Finally, using cross-dataset classification, we measured the viability of using data from one source in a more general task to detect hate speech from other sets. After calculating Weighted Macro F1 scores to give a more achievable metric between sources, we measured the Mean Rank and Mean Penalty of the datasets used for training, using their results for all test sets. Our results indicate that our use of the HateBase to characterize the different datasets might work to show the compatibility between them, with the group of Davidson, Founta, and HASOC2019 being the most compatible. As they have similar compositions, this corroborates our use of HateBase terms. Considering the Mean Rank and Mean Penalty, the HASOC2019 set seems to have the best results when training for other datasets. The more balanced types of hate terms seem to show that although the most frequent words are context-specific, it has the more general composition of hateful terms to be a good training set overall. We hope that our findings can become an essential component for effectively helping understand the hate speech phenomenon and improve its detection on social media, for instance, as an indication that for future solutions, the labeling of datasets is essential to more generalist models. For future work, we intend to examine the effect of the annotation scheme by labeling all datasets used in this work with the same set of multi-labels, similar to HASOC, and evaluating the impact on classification. [1] CJ Adams and Lucas Dixon. 2017. Better discussions with imperfect models – The False Positive – Medium. https://medium.com/the-false-positive/betterdiscussions-with-imperfect-models-91558235d442. (Accessed on 05/23/2018). [2] Fatimah Alkomah and Xiaogang Ma. 2022. A Literature Review of Textual Hate Speech Detection Methods and Datasets. Information 13, 6 (2022), 273. [3] Oscar Araque and Carlos A Iglesias. 2020. An approach for radicalization detection based on emotion signals and semantic similarity. IEEE Access 8 (2020), 17877–17891. [4] Pinkesh Badjatiya, Shashank Gupta, Manish Gupta, and Vasudeva Varma. 2017. Deep learning for hate speech detection in tweets. In Proceedings of the 26th International Conference on World Wide Web Companion. International World Wide Web Conferences Steering Committee, Republic and Canton of Geneva, CHE, 759–760. https://doi.org/10.1145/3041021.3054223 [5] Paul M Barrett. 2020. Who moderates the social media giants. Technical Report. NYU Stern Center for Business and Human Rights. [6] Valerio Basile, Cristina Bosco, Elisabetta Fersini, Debora Nozza, Viviana Patti, Francisco Manuel Rangel Pardo, Paolo Rosso, and Manuela Sanguinetti. 2019. Semeval-2019 task 5: Multilingual detection of hate speech against immigrants and women in twitter. In Proceedings of the 13th international workshop on semantic evaluation. Association for Computational Linguistics, Minneapolis, Minnesota, USA, 54–63. https://doi.org/10.18653/v1/S19-2007 [7] Emily M Bender, Timnit Gebru, Angelina McMillan-Major, and Shmargaret Shmitchell. 2021. On the Dangers of Stochastic Parrots: Can Language Models Be Too Big?. In Proceedings of the 2021 ACM conference on fairness, accountability, and transparency. Association for Computing Machinery, New York, NY, USA, 610–623. https://doi.org/10.1145/3442188.3445922 [8] Tommaso Caselli, Valerio Basile, Jelena Mitrović, and Michael Granitzer. 2021. HateBERT: Retraining BERT for Abusive Language Detection in English. In Proceedings of the 5th Workshop on Online Abuse and Harms (WOAH 2021). Association for Computational Linguistics, Online, 17–25. https://doi.org/10.18653/ v1/2021.woah-1.3 [9] Bharathi Raja Chakravarthi, Ruba Priyadharshini, Thenmozhi Durairaj, John Philip McCrae, Paul Buitelaar, Prasanna Kumaresan, and Rahul Ponnusamy.
Overview of the shared task on homophobia and transphobia detection
in social media comments. In Proceedings of the Second Workshop on Language Technology for Equality, Diversity and Inclusion. Association for Computational Linguistics, Dublin, Ireland, 369–377. https://doi.org/10.18653/v1/2022.ltedi-1.57 [10] Despoina Chatzakou, Nicolas Kourtellis, Jeremy Blackburn, Emiliano De Cristofaro, Gianluca Stringhini, and Athena Vakali. 2017. Measuring# gamergate: a tale of hate, sexism, and bullying. In Proceedings of the 26th international conference on world wide web companion. International World Wide Web Conferences Steering Committee, Republic and Canton of Geneva, CHE, 1285–1290. https://doi.org/10.1145/3041021.3053890 [11] Lu Cheng, Ahmadreza Mosallanezhad, Yasin N. Silva, Deborah L. Hall, and Huan Liu. 2022. Bias Mitigation for Toxicity Detection via Sequential Decisions. In Proceedings of the 45th International ACM SIGIR Conference on Research and Development in Information Retrieval (Madrid, Spain) (SIGIR ’22). Association for Computing Machinery, New York, NY, USA, 1750–1760. https://doi.org/10.1145/ 3477495.3531945 [12] Thomas Davidson, Debasmita Bhattacharya, and Ingmar Weber. 2019. Racial Bias in Hate Speech and Abusive Language Detection Datasets. In Proceedings of the Third Workshop on Abusive Language Online. Association for Computational Linguistics, Florence, Italy, 25–35. https://doi.org/10.18653/v1/W19-3504 [13] Thomas Davidson, Dana Warmsley, Michael Macy, and Ingmar Weber. 2017. Automated hate speech detection and the problem of offensive language. Proceedings of the international AAAI conference on web and social media 11, 1 (2017), 512–515. https://doi.org/10.1609/icwsm.v11i1.14955 [14] Fabio Del Vigna, Andrea Cimino, Felice Dell’Orletta, Marinella Petrocchi, and Maurizio Tesconi. 2017. Hate me, hate me not: Hate speech detection on facebook. In Proceedings of the first Italian conference on cybersecurity (ITASEC17). CEURWS.org, Venice, Italy, 86–95. [15] Mai ElSherief, Shirin Nilizadeh, Dana Nguyen, Giovanni Vigna, and Elizabeth Belding. 2018. Peer to peer hate: Hate speech instigators and their targets. Proceedings of the Twelfth International AAAI Conference on Web and Social Media 12, 1 (2018), 52–61. https://doi.org/10.1609/icwsm.v12i1.15038 [16] Mai ElSherief, Caleb Ziems, David Muchlinski, Vaishnavi Anupindi, Jordyn Seybolt, Munmun De Choudhury, and Diyi Yang. 2021. Latent Hatred: A Benchmark for Understanding Implicit Hate Speech. In Proceedings of the 2021 Conference on Empirical Methods in Natural Language Processing. Association for Computational Linguistics, Online and Punta Cana, Dominican Republic, 345–363. https://doi.org/10.18653/v1/2021.emnlp-main.29 [17] Karen B Enes, Matheus Nunes, Fabricio Murai, and Gisele L Pappa. 2023. Evolving Node Embeddings for Dynamic Exploration of Network Topologies. In Advances in Artificial Intelligence–IBERAMIA 2022: 17th Ibero-American Conference on AI, Cartagena de Indias, Colombia, November 23–25, 2022, Proceedings. Springer International Publishing, Cham, 147–159. https://doi.org/10.1007/978-3-031-22419ACKNOWLEDGMENTS This work was partially supported by grants from CAPES, CNPQ, FAPEMIG, and FAPESP. 513 [37] Thomas Mandl, Sandip Modha, Prasenjit Majumder, Daksh Patel, Mohana Dave, Chintak Mandlia, and Aditya Patel. 2019. Overview of the hasoc track at fire 2019: Hate speech and offensive content identification in indo-european languages. In Proceedings of the 11th forum for information retrieval evaluation. Association for Computing Machinery, New York, NY, USA, 14–17. https://doi.org/10.1145/ 3368567.3368584 [18] Klint Finley. 2015. A brief history of the end of the comments. https://www.wired.com/2015/10/brief-history-of-the-demise-of-the-commentstimeline/. [19] Paula Fortuna and Sérgio Nunes. 2018. A survey on automatic detection of hate speech in text. ACM Computing Surveys (CSUR) 51, 4 (2018), 85. [20] Paula Fortuna, Juan Soler, and Leo Wanner. 2020. Toxic, hateful, offensive or abusive? what are we really classifying? an empirical analysis of hate speech datasets. In Proceedings of the 12th language resources and evaluation conference. European Language Resources Association, Marseille, France, 6786–6794. https: //aclanthology.org/2020.lrec-1.838 [38] Binny Mathew, Ritam Dutt, Pawan Goyal, and Animesh Mukherjee. 2019. Spread of hate speech in online social media. In Proceedings of the 10th ACM conference on web science. Association for Computing Machinery, New York, NY, USA, 173–182. https://doi.org/10.1145/3292522.3326034 [39] Mainack Mondal, Leandro Araújo Silva, and Fabrício Benevenuto. 2017. A measurement study of hate speech in social media. In Proceedings of the 28th ACM Conference on Hypertext and Social Media. ACM, Association for Computing Machinery, New York, NY, USA, 85–94. https://doi.org/10.1145/3078714.3078723 [21] Antigoni Founta, Constantinos Djouvas, Despoina Chatzakou, Ilias Leontiadis, Jeremy Blackburn, Gianluca Stringhini, Athena Vakali, Michael Sirivianos, and Nicolas Kourtellis. 2018. Large scale crowdsourcing and characterization of twitter abusive behavior. Proceedings of the international AAAI conference on web and social media 12, 1 (2018), 491–500. https://doi.org/10.1609/icwsm.v12i1.14991 [40] Mainack Mondal, Leandro Araújo Silva, Denzil Correa, and Fabrício Benevenuto.
Characterizing usage of explicit hate expressions in social media. New
Review of Hypermedia and Multimedia 24, 2 (2018), 110–130. [22] Simona Frenda, Bilal Ghanem, Manuel Montes-y Gómez, and Paolo Rosso. 2019. Online hate speech against women: Automatic identification of misogyny and sexism on twitter. Journal of Intelligent & Fuzzy Systems 36, 5 (2019), 4743–4752. [41] Marzieh Mozafari, Reza Farahbakhsh, and Noel Crespi. 2020. A BERT-based transfer learning approach for hate speech detection in online social media. In Complex Networks and Their Applications VIII: Volume 1 Proceedings of the Eighth International Conference on Complex Networks and Their Applications COMPLEX NETWORKS 2019 8. Springer, Springer International Publishing, Cham, 928–940. https://doi.org/10.1007/978-3-030-36687-277 [23] Iginio Gagliardone, Danit Gal, Thiago Alves, and Gabriela Martinez. 2015. Countering online hate speech. Unesco Publishing, Online. [24] Iginio Gagliardone, Danit Gal, Thiago Alves, and Gabriela Martinez. 2015. Countering online Hate Speech. UNESCO, Online. [25] Mayur Gaikwad, Swati Ahirrao, Ketan Kotecha, and Ajith Abraham. 2022. MultiIdeology Multi-Class Extremism Classification Using Deep Learning Techniques. IEEE Access 10 (2022), 104829–104843. [42] UN Office on Genocide Prevention and the Responsibility to Protect and UNESCO.
Addressing Hate Speech on Social Media: Contemporary Challenges. UNESCO,
Online. [26] Björn Gambäck and Utpal Kumar Sikdar. 2017. Using convolutional neural networks to classify hate-speech. In Proceedings of the First Workshop on Abusive Language Online. Association for Computational Linguistics, Vancouver, BC, Canada, 85–90. https://doi.org/10.18653/v1/W17-3013 [43] John Pavlopoulos, Jeffrey Sorensen, Lucas Dixon, Nithum Thain, and Ion Androutsopoulos. 2020. Toxicity Detection: Does Context Really Matter?. In Proceedings of the 58th Annual Meeting of the Association for Computational Linguistics. Association for Computational Linguistics, Online, 4296–4305. https: //doi.org/10.18653/v1/2020.acl-main.396 [27] SK Gargee, Pranav Bhargav Gopinath, Shridhar Reddy SR Kancharla, CR Anand, and Anoop S Babu. 2022. Analyzing and Addressing the Difference in Toxicity Prediction Between Different Comments with Same Semantic Meaning in Google’s Perspective API. In ICT Systems and Sustainability: Proceedings of ICT4SD 2022. Springer, Singapore, 455–464. [44] Fabio Poletto, Valerio Basile, Manuela Sanguinetti, Cristina Bosco, and Viviana Patti. 2021. Resources and benchmark corpora for hate speech detection: a systematic review. Language Resources and Evaluation 55 (2021), 477–523. [45] Manoel Ribeiro, Pedro Calais, Yuri Santos, Virgílio Almeida, and Wagner Meira Jr.
Characterizing and detecting hateful users on twitter. Proceedings of the
International AAAI Conference on Web and Social Media 12, 1 (2018), 676–679. https://doi.org/10.1609/icwsm.v12i1.15057 [28] Yotam Gil, Yoav Chai, Or Gorodissky, and Jonathan Berant. 2019. White-toBlack: Efficient Distillation of Black-Box Adversarial Attacks. In Proceedings of NAACL-HLT. Association for Computational Linguistics, Minneapolis, Minnesota, 1373–1379. https://doi.org/10.18653/v1/N19-1139 [46] Bernhard Rieder and Yarden Skop. 2021. The fabrics of machine moderation: Studying the technical, normative, and organizational structure of Perspective API. Big Data & Society 8, 2 (2021), 20539517211046181. [29] Bing He, Caleb Ziems, Sandeep Soni, Naren Ramakrishnan, Diyi Yang, and Srijan Kumar. 2021. Racism is a virus: Anti-Asian hate and counterspeech in social media during the COVID-19 crisis. In Proceedings of the 2021 IEEE/ACM International Conference on Advances in Social Networks Analysis and Mining (Virtual Event, Netherlands). Association for Computing Machinery, New York, NY, USA, 90–94. https://doi.org/10.1145/3487351.3488324 [47] Björn Ross, Michael Rist, Guillermo Carbonell, Ben Cabrera, Nils Kurowsky, and Michael Wojatzki. 2016. Measuring the Reliability of Hate Speech Annotations: The Case of the European Refugee Crisis. In NLP4CMC. Ruhr-Universitat Bochum, Germany, 6–9. [30] Edwin Jain, Stephan Brown, Jeffery Chen, Erin Neaton, Mohammad Baidas, Ziqian Dong, Huanying Gu, and Nabi Sertac Artan. 2018. Adversarial text generation for google’s perspective api. In 2018 international conference on computational science and computational intelligence (CSCI). IEEE Computer Society, Los Alamitos, CA, USA, 1136–1141. https://doi.org/10.1109/CSCI46756.2018.00220 [48] Joni Salminen, Hind Almerekhi, Milica Milenkovic, Soon-gyo Jung, Jisun An, Haewoon Kwak, and Bernard J Jansen. 2018. Anatomy of Online Hate: Developing a Taxonomy and Machine Learning Models for Identifying and Classifying Hate in Online News Media. Proceedings of the International AAAI Conference on Web and Social Media 12, 1 (2018), 330–339. https://doi.org/10.1609/icwsm.v12i1.15028 [31] Ben Knight. 2018. Germany implements new internet hate speech crackdown. https://www.dw.com/en/germany-implements-new-internet-hatespeech-crackdown/a-41991590. (Accessed on 02/20/2023). [49] Maarten Sap, Swabha Swayamdipta, Laura Vianna, Xuhui Zhou, Yejin Choi, and Noah A Smith. 2022. Annotators with Attitudes: How Annotator Beliefs And Identities Bias Toxic Language Detection. In Proceedings of the 2022 Conference of the North American Chapter of the Association for Computational Linguistics: Human Language Technologies. Association for Computational Linguistics, Seattle, United States, 5884–5906. https://doi.org/10.18653/v1/2022.naacl-main.431 [32] Denise Law. 2017. Help us shape the future of comments on economist.com | The Economist. https://medium.economist.com/help-us-shape-the-future-ofcomments-on-economist-com-fa86eeafb0ce. (Accessed on 03/20/2023). [33] Ioanna K Lekea and Panagiotis Karampelas. 2018. Detecting Hate Speech Within the Terrorist Argument: A Greek Case. In 2018 IEEE/ACM International Conference on Advances in Social Networks Analysis and Mining (ASONAM). IEEE Computer Society, Los Alamitos, CA, USA, 1084–1091. https://doi.org/10.1109/ASONAM. 2018.8508270 [50] Leandro Araújo Silva, Mainack Mondal, Denzil Correa, Fabrício Benevenuto, and Ingmar Weber. 2016. Analyzing the Targets of Hate in Online Social Media. Proceedings of the International AAAI Conference on Web and Social Media 10 (2016), 687–690. https://doi.org/10.1609/icwsm.v10i1.14811 [51] The New York Times. 2016. The Times is Partnering with Jigsaw to Expand Comment Capabilities. https://www.nytco.com/press/the-times-is-partneringwith-jigsaw-to-expand-comment-capabilities/. (Accessed on 03/20/2023). [34] Lucas Lima, Julio CS Reis, Philipe Melo, Fabricio Murai, Leandro Araujo, Pantelis Vikatos, and Fabricio Benevenuto. 2018. Inside the right-leaning echo chambers: Characterizing gab, an unmoderated social system. In 2018 IEEE/ACM International Conference on Advances in Social Networks Analysis and Mining (ASONAM). IEEE Computer Society, Los Alamitos, CA, USA, 515–522. https: //doi.org/10.1109/ASONAM.2018.8508809 [52] Francielle Vargas, Fabiana Rodrigues de Góes, Isabelle Carvalho, Fabrício Benevenuto, and Thiago Pardo. 2021. Contextual-lexicon approach for abusive language detection. In Proceedings of the International Conference on Recent Advances in Natural Language Processing (RANLP 2021). INCOMA Ltd., Online, 1438–1447. https://aclanthology.org/2021.ranlp-1.161 [35] Lucas Lima, Julio C. S. Reis, Philipe Melo, Fabrício Murai, and Fabrício Benevenuto.
Characterizing (Un)moderated Textual Data in Social Systems. In 2020
IEEE/ACM International Conference on Advances in Social Networks Analysis and Mining (ASONAM). IEEE Computer Society, Los Alamitos, CA, USA, 430–434. https://doi.org/10.1109/ASONAM49781.2020.9381327 [53] Bertie Vidgen and Leon Derczynski. 2020. Directions in abusive language training data, a systematic review: Garbage in, garbage out. Plos one 15, 12 (2020), e0243300. [54] Nishant Vishwamitra, Ruijia Roger Hu, Feng Luo, Long Cheng, Matthew Costello, and Yin Yang. 2020. On analyzing covid-19-related hate speech using bert attention. In Proceedings of the 2020 19th IEEE International Conference on Machine Learning and Applications. IEEE Computer Society, Los Alamitos, CA, USA, 669– 676. [36] Thomas Mandl, Sandip Modha, Anand Kumar M, and Bharathi Raja Chakravarthi.
Overview of the hasoc track at fire 2020: Hate speech and offensive language identification in tamil, malayalam, hindi, english and german. In Forum
for information retrieval evaluation. Association for Computing Machinery, New York, NY, USA, 29–32. https://doi.org/10.1145/3441501.3441517 [55] Zeerak Waseem, Thomas Davidson, Dana Warmsley, and Ingmar Weber. 2017. Understanding Abuse: A Typology of Abusive Language Detection Subtasks. In Anatomy of Hate Speech Datasets: Composition Analysis and Cross-dataset Classification Proceedings of the First Workshop on Abusive Language Online. Association for Computational Linguistics, Vancouver, BC, Canada, 78–84. https://doi.org/10. 18653/v1/W17-3012 Gab: A Bastion of Free Speech or an Alt-Right Echo Chamber. In Companion Proceedings of the The Web Conference 2018 (Lyon, France) (WWW ’18). International World Wide Web Conferences Steering Committee, Republic and Canton of Geneva, CHE, 1007–1014. https://doi.org/10.1145/3184558.3191531 [56] Zeerak Waseem and Dirk Hovy. 2016. Hateful symbols or hateful people? predictive features for hate speech detection on twitter. In Proceedings of the NAACL student research workshop. Association for Computational Linguistics, San Diego, California, 88–93. https://doi.org/10.18653/v1/N16-2013 [59] Savvas Zannettou, Joel Finkelstein, Barry Bradlyn, and Jeremy Blackburn. 2020. A quantitative approach to understanding online antisemitism. Proceedings of the International AAAI conference on Web and Social Media 14 (2020), 786–797. https://doi.org/10.1609/icwsm.v14i1.7343 [57] Michael Wiegand, Melanie Siegel, and Josef Ruppenhofer. 2018. Overview of the GermEval 2018 Shared Task on the Identification of Offensive Language. In 14th Conference on Natural Language Processing KONVENS 2018. Verlag der Österreichischen Akademie der Wissenschaften, Wien, 1–10. https://epub.oeaw. ac.at/?arp=0x003a10d2 [60] Xuhui Zhou, Maarten Sap, Swabha Swayamdipta, Yejin Choi, and Noah Smith.
Challenges in Automated Debiasing for Toxic Language Detection. In
Proceedings of the 16th Conference of the European Chapter of the Association for Computational Linguistics: Main Volume. Association for Computational Linguistics, Online, 3143–3155. https://doi.org/10.18653/v1/2021.eacl-main.274 [58] Savvas Zannettou, Barry Bradlyn, Emiliano De Cristofaro, Haewoon Kwak, Michael Sirivianos, Gianluca Stringini, and Jeremy Blackburn. 2018. What is
Figures from the paper
Do you like what you are reading? Subscribe to receive updates.
Unsubscribe anytime